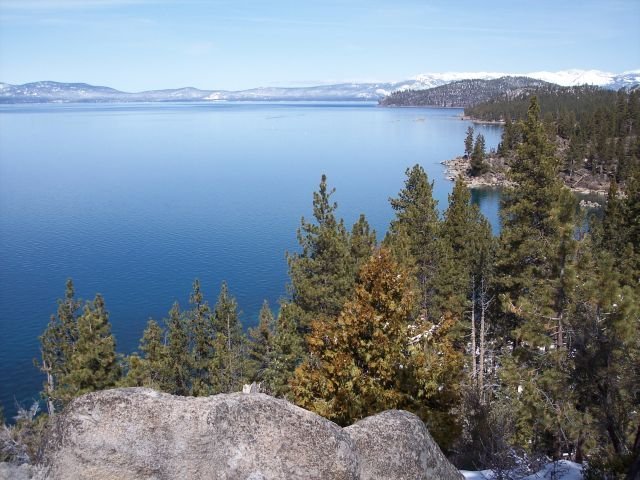
Lake Tahoe’s water level dynamics represent a complex interplay of natural and human-managed systems, revealing critical insights into regional hydrological patterns. The lake’s elevation fluctuates between 6,220 and 6,231 feet above mean sea level, with current measurements showing a 1.73-foot elevation above the standard full pool level, demonstrating the intricate balance of precipitation, snowmelt, and water management strategies in this alpine ecosystem.
What Makes Lake Tahoe Water Levels Unique?

Lake Tahoe’s water level graph is a fascinating representation of environmental dynamics, influenced by multiple factors:
How Do Seasonal Changes Impact Water Levels?
- Spring Snowmelt Influence
- Peak water levels typically occur during late spring
- Snowmelt from Sierra Nevada mountains contributes significantly
-
Average elevation increase: 3-5 feet during peak months
-
Summer Stabilization
- Water levels gradually stabilize
- Evaporation rates increase
- Recreational activities peak during this period
What Are the Historical Water Level Extremes?
| Year | Water Level (feet) | Event |
|---|---|---|
| 1907 | 6,231.26 | Highest recorded level |
| 1992 | 6,220.26 | Lowest recorded level |
| 2017-2019 | Near maximum | Consecutive high precipitation years |
How Do Measurement Techniques Work?
Water levels are precisely measured using:
– U.S. Coast Guard pier at Lake Forest
– Advanced water-stage recorders
– Geodetic vertical datum references
– Continuous monitoring systems
What Factors Influence Lake Tahoe’s Water Levels?
Critical factors include:
– Precipitation patterns
– Snowmelt volume
– Evaporation rates
– Water management strategies
– Climate change impacts
Can Climate Change Affect Lake Tahoe’s Water Levels?
Recent studies indicate potential long-term impacts:
– Increased temperature variations
– Altered precipitation patterns
– Reduced snowpack reliability
– Potential long-term water level fluctuations
How Accurate Are Current Measurement Techniques?
Modern monitoring provides:
– Real-time data updates
– Precision within 0.01 feet
– Multiple cross-verification methods
– Comprehensive digital tracking systems
What Are the Implications of Water Level Changes?
Potential consequences include:
– Ecological habitat modifications
– Recreational activity adjustments
– Water resource management challenges
– Economic impacts on local communities
Technical Monitoring Details

Measurement Location: Lake Forest Pier
Datum Reference: National Geodetic Vertical Datum of 1929
Current Elevation: 6,226.73 feet MSL
Deviation from Full Pool: +1.73 feet
Conclusion
The Lake Tahoe level graph represents more than numerical data—it’s a dynamic narrative of environmental interactions, revealing the delicate balance between natural systems and human management strategies.

